
Offensive flight operations predicting
What indicators at Russian forward operating bases signal impending offensive air operations, and how far in advance do they become detectable in commercial satellite imagery?
- Status
- In progress. Draft findings expected at the end of the semester.
- Category
- Military conflict
- Region
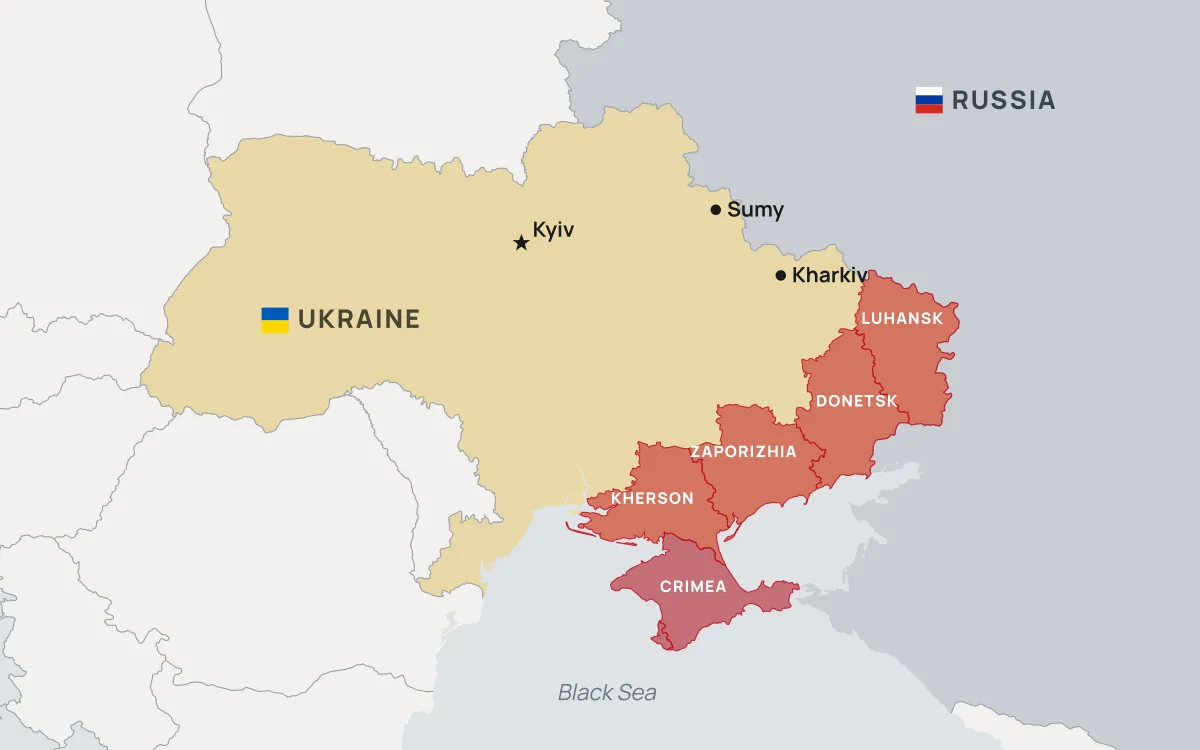
- Ukraine, occupied Ukrainian territory, and western Russia
- Method
- Multi-temporal analysis of optical and radar satellite imagery, cross-referenced against dated strike records
Team
[FO-56] One sentence on how this team was put together, or CUT

[FO-50] name
Project Manager
[FO-51] name
Research Analyst
[FO-52] name
Research Analyst
[FO-53] name
Research Analyst
[FO-54] name
Research Analyst
[FO-55] name
Research Analyst
Background
Since the full-scale invasion of Ukraine began in February 2022, open source analysts have used freely available satellite imagery to track activity at airfields on both sides of the front. The underlying observation is old and comes out of Cold War imagery intelligence practice: sustained air operations require visible preparation. Aircraft are moved out of shelters and dispersed across a field. Fuel bowsers and munitions handling equipment appear near revetments. Ground support vehicles cluster where they were not clustered a week earlier.
What has changed is who can see it. Copernicus Sentinel-2 delivers 10 metre imagery in its visible and near-infrared bands on a revisit cycle of roughly five days, and Sentinel-1 images the same locations with synthetic aperture radar, which works at night and through cloud. Both are free. That is coarse compared with what a state intelligence service can task, but it is enough to count large aircraft on an apron and to detect changes in how a base is laid out.
The gap this project addresses is that most published open source airfield analysis is episodic. An analyst posts imagery of one base after an event has already happened. Whether the same signatures hold up systematically across many bases and many months, and whether they appear early enough to be useful as warning rather than confirmation, has not been tested in a way that is easy to check.
Research questions
- Which observable features at a forward operating base change in the days before a documented increase in offensive sorties?
- How much lead time do those changes provide, measured from first detectable change to the strike or sortie surge?
- How often do the same indicators appear without a subsequent operation, and what does that false positive rate do to the usefulness of the method?
Approach
The work runs in four stages.
1. Build the base inventory
Compile a list of airfields within operational range of the front, with coordinates, runway configuration, hardened shelter counts, and revetment layout. Locations come from open aviation databases and OpenStreetMap and are checked against imagery rather than trusted directly.
2. Assemble the imagery time series
Pull every usable Sentinel-2 scene over each base for the study period, plus Sentinel-1 scenes for dates where cloud cover makes the optical imagery unusable. Cloud masking and scene selection are scripted so the sample is reproducible instead of hand-picked.
3. Code the indicators
For each scene, record a fixed set of observations: aircraft visible on apron versus in shelters, vehicle concentrations at fuel and munitions points, activity at dispersal pads, and any new construction. Coding is done against a written rubric so two members looking at the same scene produce the same values, and a sample is double coded to measure agreement.
4. Align against the event record
Join the coded observations to dated records of strikes and air activity, then measure whether indicator changes lead events and by how much. Bases and periods with no associated activity serve as the comparison set.
Data sources
- Copernicus Sentinel-2 optical imagery (Level-2A surface reflectance). European Space Agency, via the Copernicus Data Space Ecosystem.
- Copernicus Sentinel-1 synthetic aperture radar imagery. European Space Agency, via the Copernicus Data Space Ecosystem.
- Armed Conflict Location and Event Data Project (ACLED), Ukraine event records. Used for dated strike and air activity events.
- Institute for the Study of War, Russian offensive campaign assessments. Used as a secondary check on the event timeline.
- OpenStreetMap and OurAirports, airfield locations and runway attributes. Cross-checked against imagery before use.
- Natural Earth, administrative boundaries and base cartography. Public domain.
Limitations
Ten metre imagery cannot resolve aircraft type, and it cannot distinguish an airframe from a decoy. Optical coverage is lost to cloud for long stretches of the Ukrainian winter, which is exactly when the analysis would be most valuable, and radar only partly compensates because the features being coded are easier to read optically. Camouflage, netting, and deliberate deception are all in use and all degrade the indicators.
The event record is also imperfect. Strikes are reported by belligerents with obvious incentives, and independent confirmation often lags by days. Any lead time this project measures should be read against that uncertainty rather than as a precise figure.
Publication
Findings, the coding rubric, and the scene list will be posted here when the project concludes. Maps produced along the way appear on the Map Wall.