
Taiwanese energy resilience
How robust do current policies leave Taiwan's domestic energy supply under a blockade or quarantine? What do import dependency, strategic reserves, and grid layout say about how long critical functions could keep running?
- Status
- In progress. Draft findings expected at the end of the semester.
- Category
- Trade
- Region
- Taiwan and the Taiwan Strait
- Method
- Spatial inventory of energy infrastructure, combined with a duration model run against blockade scenarios
Team
[TE-56] One sentence on how this team was put together, or CUT

[TE-50] name
Project Manager
[TE-51] name
Research Analyst
[TE-52] name
Research Analyst
[TE-53] name
Research Analyst
[TE-54] name
Research Analyst
[TE-55] name
Research Analyst
Background
Taiwan imports almost all of the primary energy it consumes. Coal and liquefied natural gas arrive by sea into a small number of terminals, and the island has no pipeline connection to any neighbour and no interconnection with another country's grid. Whatever is not already in storage has to come in by ship, past waters that a blockading force would control first.
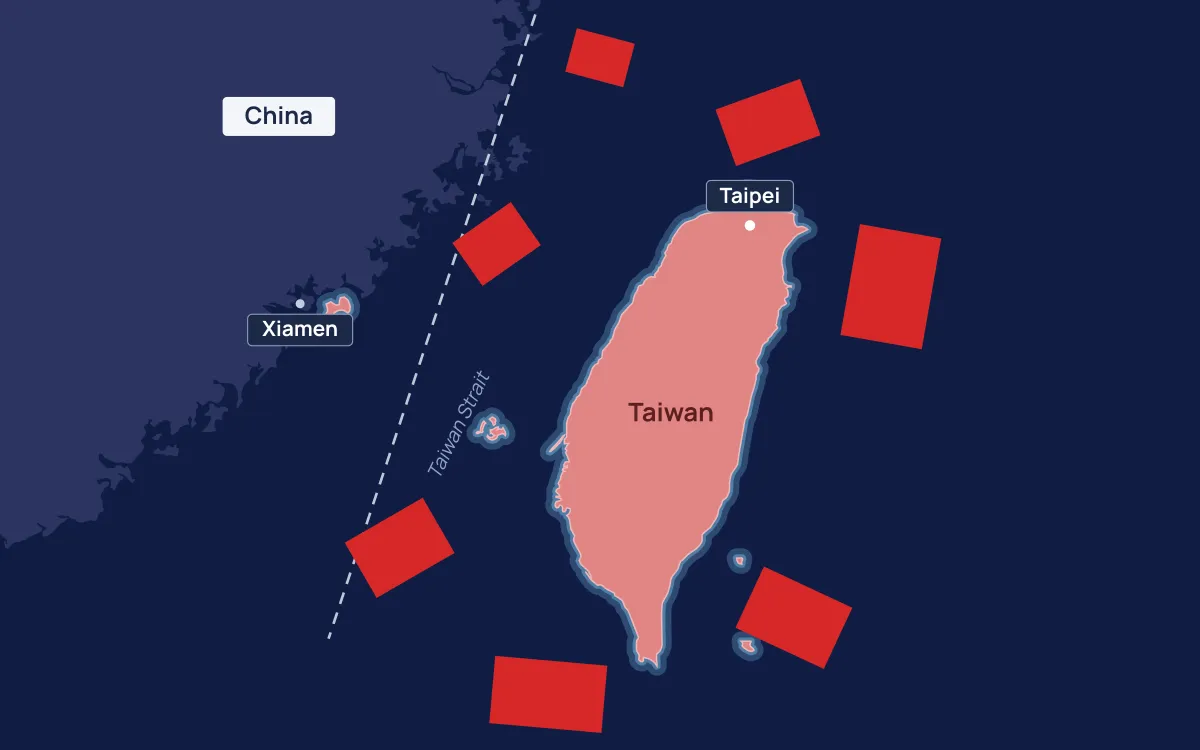
The scenario that usually gets discussed is an invasion. A blockade or a declared quarantine is more likely and considerably harder to answer, because it does not require an amphibious landing and it can be tightened or relaxed as leverage. It also puts the pressure somewhere specific. Rather than everywhere at once, it lands on a handful of receiving terminals and the storage behind them.
Reserve figures are published as national totals, usually in days of consumption. That framing hides the part that matters geographically. Reserves sit in particular tanks, connected to particular plants, on one side of an island whose transmission network runs mostly north to south. A national average tells you nothing about which region loses power first, or which plant is stranded from the fuel that feeds it.
Research questions
- Where does Taiwan's imported energy physically enter the island, and how concentrated is that entry across terminals and berths?
- Given published reserve levels and generation capacity, how long can hospitals, water treatment, telecommunications, and semiconductor fabrication keep operating once imports stop?
- Which parts of the grid fail first, and does the answer change if demand is rationed to critical loads early rather than late?
Approach
1. Map the energy system
Build a spatial inventory of LNG receiving terminals, coal ports, oil refineries and storage, power stations with their fuel type and nameplate capacity, and the high voltage transmission network connecting them. Everything comes from public sources and gets a coordinate, so the result is a map rather than a table.
2. Locate the critical loads
Identify the facilities whose loss has consequences beyond inconvenience: hospitals, water and wastewater treatment, major telecommunications sites, and the semiconductor fabrication plants. Each gets tied to the substation and generating capacity it depends on.
3. Define scenarios
Model a small number of clearly stated disruption cases rather than one vague crisis. A partial quarantine that inspects and delays shipping. A full blockade of the western ports with eastern approaches still open. A total cutoff. Each scenario is defined by which terminals stop receiving and on what date, and nothing else.
4. Run the duration model
For each scenario, draw down reserves at documented consumption rates and record when each fuel type is exhausted, when each plant stops, and which loads lose supply. The model is deliberately simple and its assumptions are written out, because the useful output is the ranking of vulnerabilities, not a precise number of days.
Data sources
- Bureau of Energy, Ministry of Economic Affairs (Taiwan), energy statistics and the energy balance sheet. Primary source for consumption, import share, and fuel mix.
- Taiwan Power Company (Taipower), generation capacity and system operation data. Primary source for plant level capacity.
- U.S. Energy Information Administration, country analysis for Taiwan. Used as a cross-check on the national figures.
- Global Energy Monitor, Global Coal Plant Tracker and the oil and gas infrastructure trackers. Used for plant and terminal locations and status.
- World Resources Institute, Global Power Plant Database. Used as a secondary check on plant coordinates and capacity.
- OpenStreetMap, power infrastructure and port features. Transmission lines and substations, checked against imagery.
- Natural Earth, coastlines, bathymetry, and base cartography. Public domain.
Limitations
Strategic reserve levels are a matter of national security and the published figures are national aggregates. Any allocation of those reserves to specific sites is an estimate, and the project will say so wherever it makes one. Grid topology from OpenStreetMap is uneven in coverage and needs checking line by line against imagery.
The larger caveat is behavioural. A duration model assumes consumption continues at documented rates until supply runs out. In an actual blockade a government would ration, industry would shut down, and demand would fall well before reserves were exhausted. The figures this project produces are therefore a floor on endurance under unchanged behaviour, not a forecast.
Publication
Findings, the infrastructure inventory, and the model assumptions will be posted here when the project concludes. Maps produced along the way appear on the Map Wall.