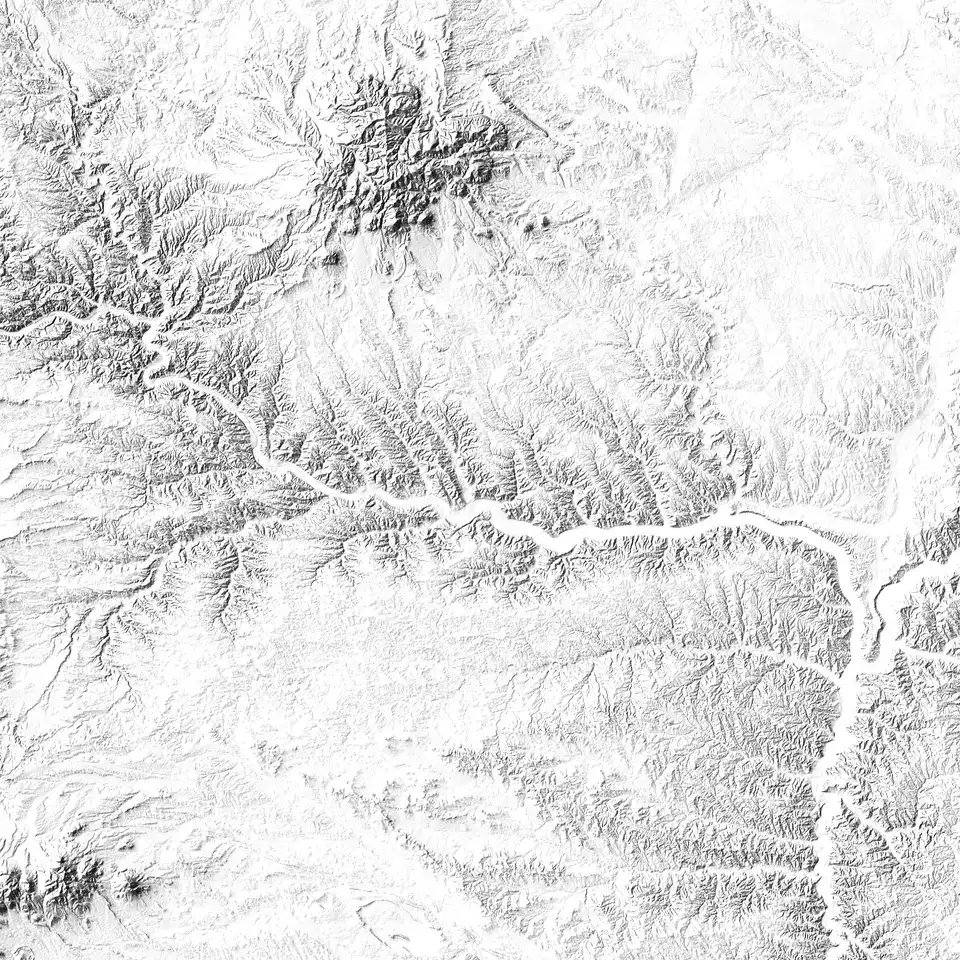
A Geographic Information System is software for asking questions with maps. It stores the world as layers: terrain, boundaries, roads, incidents, anything that has a location. You can then stack those layers up, compare them, and analyze them together.
Almost every dataset that matters to policy has a where attached. GIS is how you use it.
Hover the stack to pull the layers apart.
Buffer the route, join it to census blocks, and count the people inside. Transit equity becomes a number you can check.
Overlay grocery locations, walking distance, and income data, and the gaps show up on the map.
Compare satellite imagery of the same place over time, whether that is a military site, a port, or a border. Open-source analysts do this every day.
Epidemiologists use it. So do urban planners, humanitarian responders, and intelligence analysts.
The tools are free and the data is public.
QGIS is free and open-source, needs no license, and runs on most machines. Download it at qgis.org.
DC publishes hundreds of clean datasets at opendata.dc.gov, covering wards, transit, housing, trees, and crime. Load any one of them and you have a map.
Our Zero-to-Map workshop series gets you from install to analysis in four sessions.
Members publish their work, under their own name, on the SPL Atlas and the Map Wall.